Users never like waiting. In order to recognize such situations immediately, censhare 4.8 introduces performance statistics which directly reflect the user experience. Now Support can react immediately and solve the problems.
Rapid response when users have to wait
A smoothly running system is important for the productivity of employees. Problems are not always immediately recognizable, especially when the system just starts running a little slower. At some point the calls to Support start to ramp up. In order for them to act before users even notice anything, censhare 4.8 is introducing performance statistics. These provide a good indication of whether users are experiencing a fast and responsive system. censhare can also share the performance data with an external monitoring system. If the values exceed a threshold value, the monitoring system automatically calls on Support.
The performance statistics, however, are not only important for recognizing user problems. They also provide indications to help Support locate the cause in the system. After all, the bottleneck does not have to be in the censhare server or the censhare client, but could perhaps be caused by the network. Or the censhare server is having to wait for another IT system that has problems, and this slows it down.
Finally, the statistics help to recognize gradual deteriorations in performance. In such cases, the system does gradually become slower, but almost imperceptibly for users. Only with a longer-term assessment of the data can such a trend be clearly identified. This could be a sign that some of the hardware needs upgrading. With monitoring, such things can be detected at an early stage and dealt with.
Customer benefits
Extension of monitoring of production critical systems
Automatic monitoring of response time for users
Long-term data about performance trends in response time and a timely reaction
Performance statistics indicate the area where a bottleneck occurs
Monitoring of the performance values with an external monitoring system such as Nagios over a REST interface
Application case
Assistance from Support and IT in the operation of a censhare system
Pinpointing the cause of a performance problem
Clarification of whether a system upgrade is necessary due to rising user numbers
Automatic monitoring of a censhare system by a service provider and their notification when problems arise
Performance monitoring in practice
Statistics on loading are essential for the monitoring of a censhare system. Important indicators include the memory usage of the Java Virtual Machine or the number of communications connections between censhare server and database. Useful indications are also provided by the number of connections between censhare server and client (RMI connections, Remote-Method-Invocation). censhare 4.8 complements the data on the general loading of the system with statistics, which reflect the performance from the user's point of view.
The new statistics include SQL performance, "waiting for CPU time", as well as store, management and query for assets. SQL performance reflects the loading of the Oracle database. "Waiting for CPU time", also known as "pausing", indicates the occasions when a censhare server process has to wait for processing time. With asset store, Support sees how busy the censhare database is. It is optimized for pure read access, automatically synchronized with the Oracle database, and ensures a quick response for operations like searches. With asset management, it is a question of the time taken by asset-operations like check-in or check-out. Asset-Query indicates how long the search for assets takes.
The statistics are available either in the censhare admin client or in an external monitoring system such as Nagios. For the latter there is a REST interface, over which a monitoring system can query the values.
Besides problem diagnosis, two further important functions can be realized in connection with a monitoring system: automatic alarms for critical values and monitoring of trends. In order to set sensible threshold values for alarms, first the typical values in normal operation in a censhare system (Baselining) must be determined.
Passive monitoring is employed to collect data on the censhare system. This means that only the duration is measured for actions which take place in the system. The monitoring therefore imposes no additional load on the system.
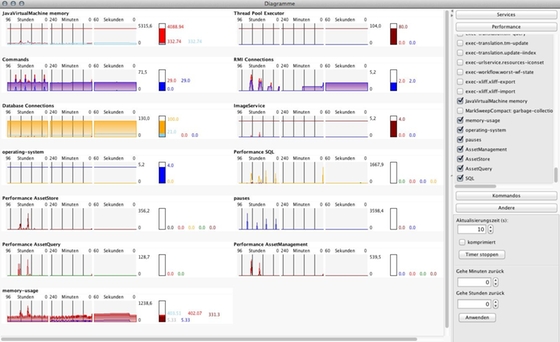
The statistics in detail
In order to examine the user performance statistics in the admin client, the user invokes the "Diagrams" entry in the "Status" area. A new heading "Performance" is located here, to contain the additional statistics. Besides that, there is a range of "exec" statistics. This covers the measurements for the execution times of the individual server modules. For example "exec-asset.query" comprises the total time necessary for the execution of the command, starting with invocation by the client. This time also includes the time for the actual query in the censhare database, the Asset Query value. If the search takes too long, comparing the two values will show: is the problem in the actual query or in another area?
The statistical value for a module is only displayed if this has been executed at least once on the server. If a statistical value is still not visible, the diagram window must be briefly closed and reopened. This will cause the list of values to be automatically updated.
As was the case with the previous statistical values, the new overviews divide their data into three sections: the last 60 seconds, the last 240 minutes and the last 96 hours. There are three REST-Interfaces for external monitoring programs to call up data: "server statistics" provides an overview of the available statistical values with the associated keys. A second command "server statistics/key/{key}" uses these to call up the data for a particular statistical value with the three time periods. A third command "server-statistics/key/{key}/latest" can optionally return the latest data.
For SQL Performance, censhare measures the time for the following SQL operations on the Oracle database: Insert, Update, Delete and "Generate ID". Other operations are ignored, since their execution times are variable and therefore cannot show changes in response time.
Asset management takes account of the operations Check-in, Check-out, Update and "cancel Check-out" for the performance measurements.
The Asset-Store statistical value takes account of the operations Update, Get and Checkpoint in the censhare database. With Get the database reads an asset with a particular ID. For performance reasons, the database holds all its data in main memory. If there are changes due to synchronization with the Oracle database, the Update operation initially modifies only values in main memory. At configurable intervals the checkpoint operation causes the censhare database to write the changes to disk.